Thursday 3 July 2014
If anyone needed reminding this week about the risks around energy supply they only had to look at the satellite image below of Iraq’s largest oil refinery in flames. Recent events in Iraq as well as Ukraine have once again put energy security high on the agenda for governments and organizations.

Against this background The Crowd (http://www.thecrowd.me) held their Green Corporate Energy 2014 event on the 25th June and it was great to be a part of the team that launched a new initiative called the Energy Investment Curve.
The Energy Investment Curve
The Curve is an experiment in peer-to-peer sharing of data about energy investments made by corporates and public sector organizations. It is designed to allow people looking at energy investments to see what their peers are doing, learn from experience, help form business cases and provide a new source of data on what is happening in the market. Our vision is that it will help accelerate investment in energy demand side measures. It was designed to be easy to enter data as energy and sustainability managers are already deluged by numerous forms and data requests – the record for completing it with five investments was 14 minutes (subsequently broken after the event by a new contributor!). Anyone with an energy budget greater than £50k per annum can contribute their own data and once they do they can look at the overall results. The identity of contributing companies is protected. The data form is here: https://www.surveymonkey.com/s/thecurve.
It asks for information on five energy investments covering; what it is, what was the capex, what is the payback period as well as general information about energy spend and payback thresholds. You can see an overview of the information we are collecting here. Once you have entered your information you will be able to access the results – you have to share to be able to benefit from the experience of The Crowd.
We think that the Energy Investment Curve will help you to:
- Find organizations that have made similar investments to ones you are considering – you can learn from their insights, and request an introduction.
- Compare your energy investment programme with others – both within your own sector and across sectors – helping you to see if you missed anything and where have others achieved different results.
- Support your investment cases, using the validation of others by seeing what their paybacks have been, and where they have found added benefits.
We had an initial 60 seed contributors who have provided data. A big thank you to them all – many leading organizations in energy and carbon management as well as the wider sustainability field. In summary the seed contributors had:
- an aggregate energy spend of more than £1 billion per annum (about 7% of the UK industrial and commercial energy spend)
- entered information on 160 investments
- a total investment of £360m
- an average payback period on that investment of 3.2 years
The Energy Investment Curve is designed so that the data can be looked at through three lenses:
- investment and payback
- co-benefits
- quality.
Investments and paybacks
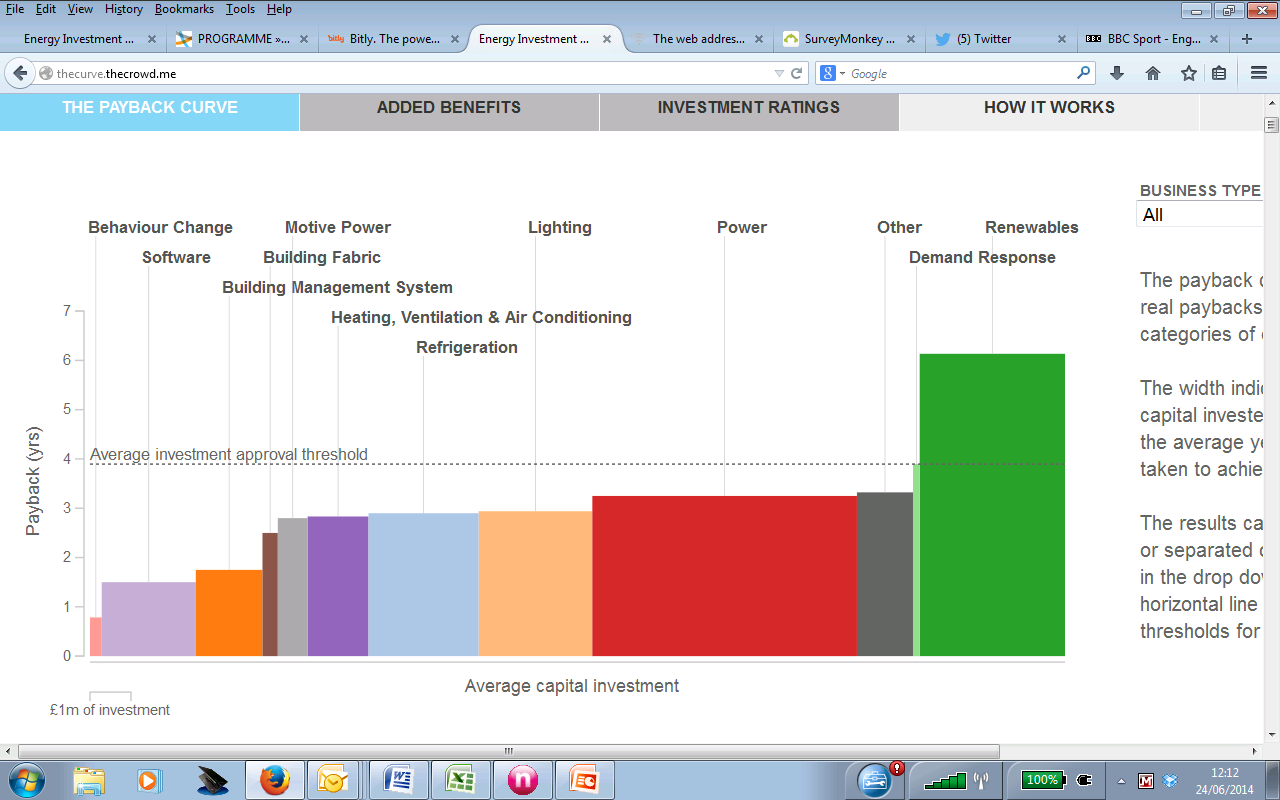
Figure 1 shows the total investment by technology with payback period on the y-axis and the amount of investment in each category shown by the width of the column.
Even at this level the curve shows a number of interesting things including:
- the average payback period that is accepted for renewables (which includes CHP) at about 6 years is about twice as long as the average for all investments. Clearly organizations are accepting longer payback periods for renewables than for other investments.
- a large investment in power – this was skewed by a large investment in voltage optimization.
- behaviour change and software measures had quick payback periods which would be expected as they are both capital light measures
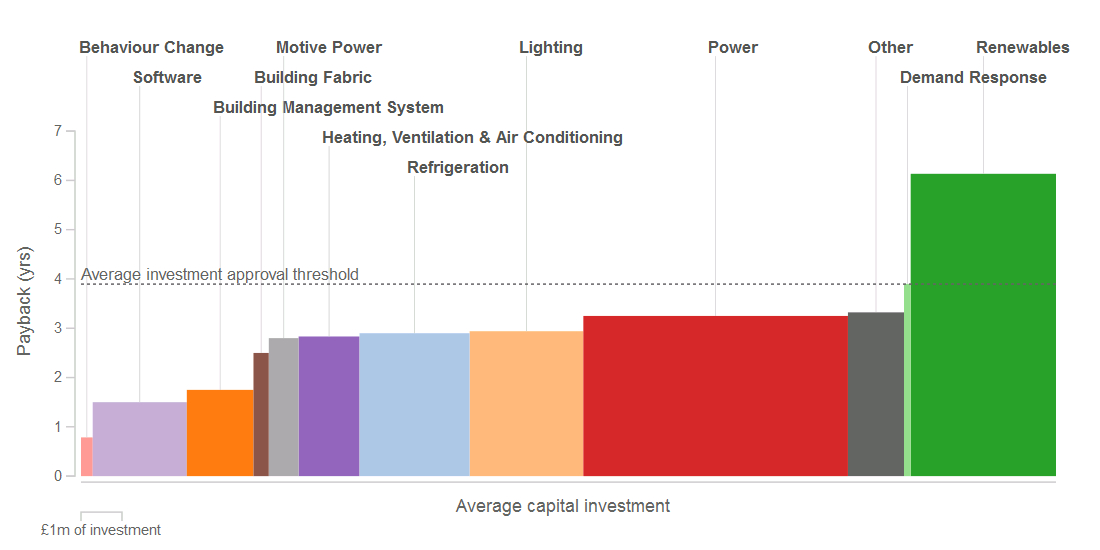
Figure 1. The Energy Investment Curve – all sectors – seed contributors
Wouldn’t you like to run through this list to check you haven’t missed possible investments? Well now, you can. And imagine if instead of 160 investments there were 1,600 rather than 160. The question to ask yourselves is “how long will it take you to identify all of these possibilities through the normal ways of doing business?” This is a tool for reducing the discovery time and it is a tool for sharing knowledge between organizations working to invest in energy demand side measures.
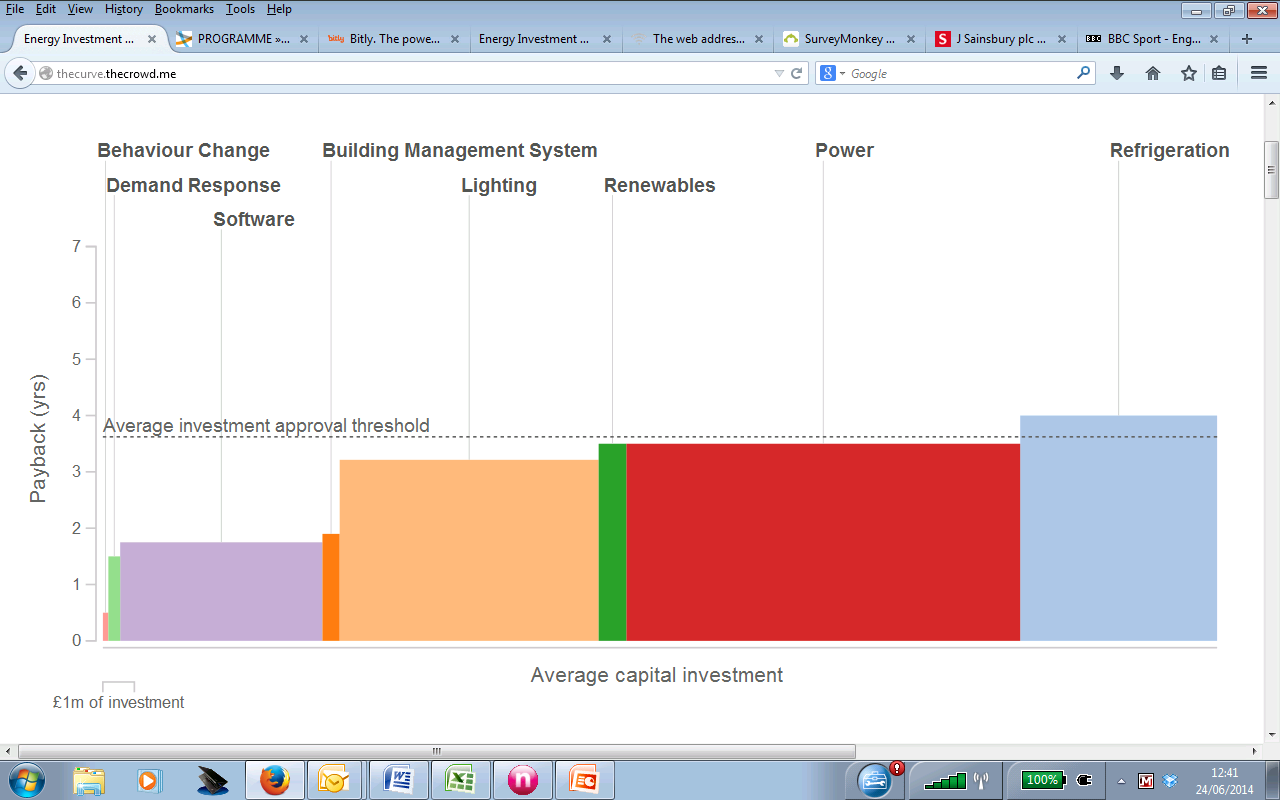
The curve allows you to search by sector so that you can see what your sector peers are doing. Figure 2 shows the curve for the retail sector.
There are 29 investments in the retail sector. Payback periods are slightly higher than the overall sample – 3.7 years versus 3.2 average. As you might expect the investments are dominated by power, refrigeration and lighting measures – which reflects the energy breakdown in the retail sector.
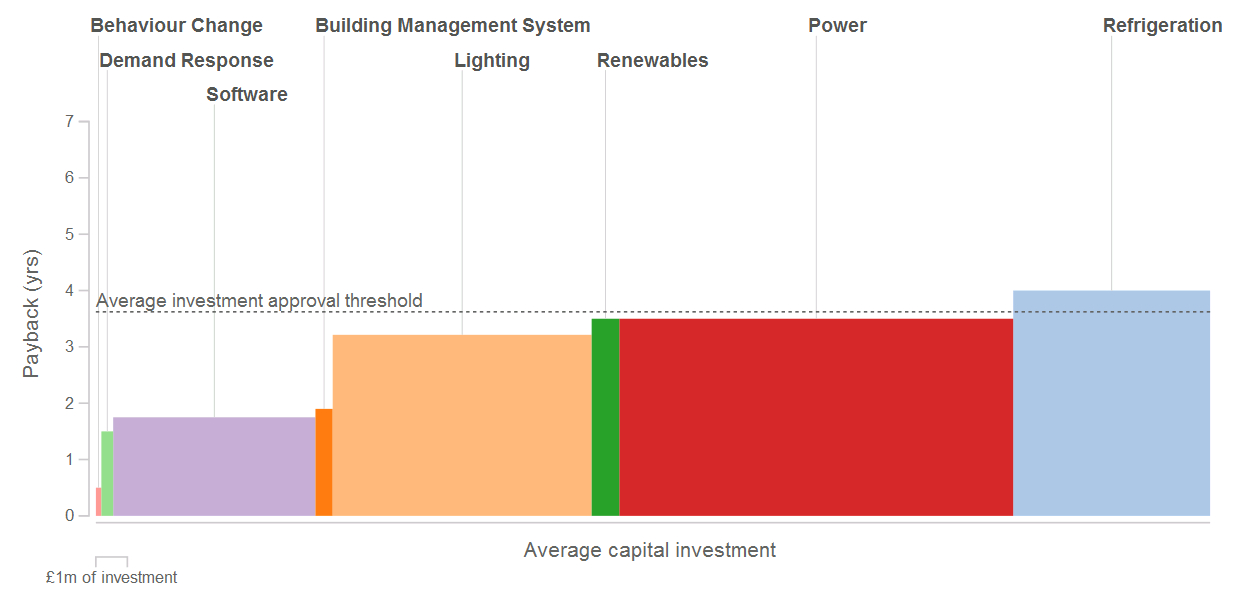
Figure 2. The Energy Investment Curve – retail sector – seed contributors
Using the Energy Investment Curve, energy professionals in organizations, suppliers and government can actually see the pattern of energy investment across different sectors – really for the first time. As well as helping organizations one of the problems for the energy demand side industry and government is simply measuring it – the Curve is a tool that enables measurement of the industry size and its breakdown between categories. This is important because we have always had trouble measuring the size of energy efficiency and demand side investment. If we take the sample as representative of the industrial and commercial sector as a whole (which may not be quite right due to the fact that the sample is large firms), we might estimate that the total investment in the energy demand side is of the order of £6 to £7 billion – which should be compared to the £12 billion that was invested in energy supply in the UK in 2013.
One of the problems in the whole energy arena is confusion of terms. A few years ago a group of us started using the phrase “D3” to encompass all demand side activities – D3 is Demand Management (permanent reduction of load – more commonly called energy efficiency), Demand Response (temporary shifting of load), and Distributed Generation (generation on the distribution system such as on-site renewables and CHP). The Energy Investment Curve showed that investment was split roughly 2/3rd to demand management (energy efficiency) and 1/3rd to distributed generation with only a small amount on demand response. Given the pressure on the electricity grid and the increasing number of schemes to encourage demand response the small investment in demand response was surprising – and perhaps worrying for the grid. It will be interesting to see how this changes over the coming years.
The investment in distributed generation was split as follows:
- Biomass (various forms) – £48m
- Photovoltaics – £47m
- CHP/trigeneration – £19m
- Wind – £5m
- Hydro – £1.8m
- Solar thermal – £30k
There were 13 investments in PV with a total investment of about £10m – ranging in size from £5,000 to £3.75 million.
Given the revolution in LED lighting that is happening it was not surprising to see the level of investment in LEDs. Of 25 lighting investments, 19 specifically mentioned LEDs and of the £49m invested in lighting, about £46m of this was in LEDs.
A quick and dirty calculation suggests that the energy investments produced a levelized cost of electricity of about £30/MWh and a levelized cost of £8/MWh for gas1 – supporting the contention that energy efficiency is the cheapest way of delivering energy services. Refinement of this calculation would be helpful for making the case that efficiency is cheaper than new supply.
Counting co-benefits
The second lens we can look at the Energy Investment Curve data through is co-benefits. The co-benefits of energy efficiency investments are really important and increasingly being recognized. The IEA is about to publish a big piece of work on co-benefits and some research shows that co-benefits of energy efficiency investments can actually be worth four times the energy savings, which would take a 4 year payback period project on energy alone to a 1 year payback period if those benefits are properly quantified and evaluated. That is only counting the benefits to the host – not including wider social benefits. Examples of co-benefits include better quality, removing production bottlenecks and increasing employee engagement.
A lot of the smarter energy management programmes are incorporating added benefits into their business cases. Tim Brooks of Lego (my all time favourite toy and inspirer of engineers everywhere) talked about this in his excellent presentation at GCE14. I can’t resist saying that Lego build up their investment case block by block incorporating co-benefits where they can. The uncertainty of some co-benefits is recognized in the process.
Other organizations are just recognizing the existence of benefits in their business case. For many years I have argued that energy and energy efficiency is a strategic matter – a matter of competitive advantage – and not just about cost savings. Catherine Cooremans, a business academic in Switzerland, has written extensively about the need to recognize the strategic value of energy efficiency investments (source 1 and source 2. Competitive advantage has three dimensions – COST, VALUE and RISK. Energy efficiency addresses all these three but my contention is that the energy efficiency industry has not been good at making this case – it has always focused on energy costs alone. We need to stress the existence of co-benefits and always include them in business cases. A rejoinder to this is that they are hard to measure – and that can be true – but business cases for other things like increased advertising are also often based on hard to measure variables. Co-benefits need to be valued wherever possible but at least recognized.
The Energy Savings Opportunities Scheme (ESOS) is coming into force soon in the UK and will mandate large organizations to have an energy survey every four years to identify energy saving opportunities. A good feature of ESOS introduced by DECC is that the survey has to be signed off by a board director. One of my concerns, however, is that energy surveys are done by energy efficiency specialists – who have also written the standards for doing energy audits such as EN16247. Standards for things like energy audits are good but traditionally audits only look for energy benefits and that is now enshrined in a standard. Energy efficiency industry and energy managers need to raise their game – particularly around ESOS otherwise we are in danger of repeating history and producing energy audit reports that identify opportunities but sit on shelves – unused because they don’t recognize co-benefits and the strategic value of energy efficiency. Back in the 1980s and 1990s we had to teach energy managers about investment appraisal techniques like IRR and NPV – now we need to teach them to look for and value co-benefits. It is no good complaining that the board does not recognize the co- benefits if no one identifies and evaluates them.
We looked at 13 co-benefits in the Energy Investment Curve including the obvious reduction in carbon emissions through to brand enhancement, employee engagement and reduction in supply risk. Figure 3 shows the results from the seed contributors for co-benefits – the size of the dot reflects how many times the benefit was mentioned. The most often mentioned co-benefit – no big surprise – is reduced carbon emissions. The second biggest is employee engagement, particularly in renewables and lighting, which are perhaps the most visible energy investments.
Interestingly renewables produced the largest employee engagement benefit as well as the largest carbon emission reduction benefit. Presumably this is to do with the very visible nature of many renewable investments such as PV and the ability to show data on energy production.
An example of co-benefits is given by the following example. A £1.75m resource conservation programme was rolled out across the west European sites of a Manufacturing / Industrial company. It paid back in around 18 months, and the company described it as “an excellent opportunity to engage with employees about what they can do to reduce energy & water usage” and gave it 5 stars.
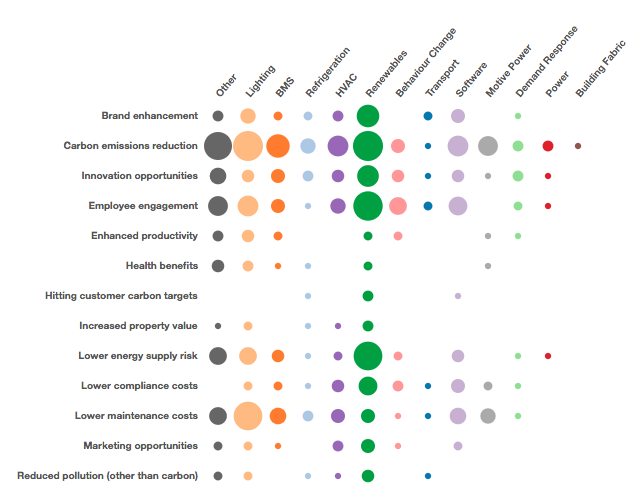
Figure 3. Co-benefits – seed contributors
Investment star ratings
The third lens that you can use to look at the data from the Curve is star ratings of investments. Generally ratings were high but of course that can be expected as people are more likely to submit their good investments – the ones that went well – rather than the ones that went badly. Renewables had the widest range of star ratings – all the way from 1 to 5. This may reflect the fact that the renewables boom has attracted many new entrants, not all of whom may be high quality organizations, or perhaps more charitably it reflects the fact that this is a new area in which we are all learning. Figure 4 shows the ratings in the seed contributors’ data.
In the data you’ll find a 3rd party financed PV array by a retailer with a comment: “The third party funded nature of the array limits financial gain to our organisation but provides a visible carbon reduction and energy efficiency story to our customers, team members and stakeholders.” if you’re thinking about making a similar investment, you’ll be reassured by the comment and note the co-benefits but you’ll wonder why they only gave it a 3 star rating. If you do then you can use the Curve to request an introduction and find out more.
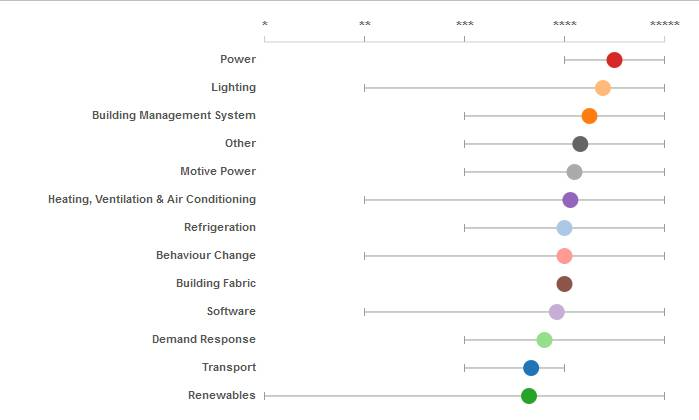
Figure 4. Star ratings – seed contributors
Problems with the data and improvements
The Energy Investment Curve we launched at Green Corporate Energy 2014 was a prototype – an experiment in co-creation – and can undoubtedly be improved. Amongst other things we have identified the following issues:
- We only asked for up to five investments – many organizations have made many more than five investments.
- We didn’t ask about the timescale over which the investments were made.
- People are likely to self select their best investments.
- There were some issues with categorization of investments.
- We should have allowed a free field entry for energy spend.
- We are relying on judgement rather than precise measurement but that is the philosophy of The Crowd.
- There was no question comparing actual to projected performance of the investments – although it appears that many organizations do not actually measure post-investment performance.
In the spirit of The Crowd we want to improve the Energy Investment Curve and expand its reach collaboratively. We are looking to form a small group to help improve it and steer its direction. We also want to expand its reach across the UK – and ultimately beyond – and will keep it open to new data. Please encourage other energy users to complete the data form.
Discussion
We know that there is still a massive opportunity for profitable investment in the energy demand side (D3) – in demand management (energy efficiency), demand response and of course distributed generation. Increasing the level of investment in these areas would bring great benefits to organizations – financial and other benefits – as well as to the country as a whole and the environment. D3 is the cheapest, cleanest and fastest energy resource that we have but it is not often thought about as a resource which sits alongside oil, gas, coal, renewables and nuclear. Many leading organizations over many years have shown that the energy efficiency resource just keeps giving. Companies like Dow Chemicals and 3M have consistently improved their energy efficiency and reduced consumption year after year and indeed decade after decade. Here in the UK BT has reduced its energy use year on year for five years, knocking £131m off its annual energy spend and reduced carbon emission by over 80% compared to 1996 baseline.
We hope that the Energy Investment Curve will grow and be used by many other organizations, helping them to increase investment in energy demand side measures and improve the returns from that investment, both from energy savings and the very valuable co-benefits. If we can do that we will be contributing to greater use of the demand side resource and helping to address the energy related problems we face – corporately, nationally and globally.
Steven Fawkes
28 June 2014
Comments
Comments are closed.
Dr Steven Fawkes
Welcome to my blog on energy efficiency and energy efficiency financing. The first question people ask is why my blog is called 'only eleven percent' - the answer is here. I look forward to engaging with you!
Get in touch


Tag cloud
Black & Veatch Building technologies Caludie Haignere China Climate co-benefits David Cameron E.On EDF EDF Pulse awards Emissions Energy Energy Bill Energy Efficiency Energy Efficiency Mission energy security Environment Europe FERC Finance Fusion Government Henri Proglio innovation Innovation Gateway investment in energy Investor Confidence Project Investors Jevons paradox M&V Management net zero new technology NorthWestern Energy Stakeholders Nuclear Prime Minister RBS renewables Research survey Technology uk energy policy US USA Wind farmsMy latest entries
- ‘Here we go again’ – but this time we have a choice
- The corruption of purpose in business – and how to address it
- Gee, I wish we could have a white Christmas, just like the old days….
- A look back at the last forty years of the energy transition and a look forward to the next forty years
- Domains of Power
- Ethical AI: or ‘Open the Pod Bay Doors HAL’
- ‘This is not the end. It is not even the beginning of the end. But it is, perhaps, the end of the beginning’